Market Outlook
August 11, 2017
Market Cues
Domestic Indices
Chg (%)
(Pts)
(Close)
Indian markets are likely to open weak tracking global indices and SGX Nifty.
BSE Sensex
(0.8)
(267)
31,531
After two days of weak trading U.S. markets ended sharply lower on Thursday amid
Nifty
(0.9)
(88)
9,820
huge selling pressure and both Nasdaq and Dow Jones closed at their lowest levels
Mid Cap
(2.6)
(401)
14,756
in a month. Geopolitical concerns, the tension between US and North Korea
Small Cap
(3.6)
(563)
15,071
continued to weigh on the markets and the trend is likely to continue in the near
Bankex
(0.7)
(201)
27,340
term.
The European markets also suffered losses due to the sharp selling in the US
Global Indices
Chg (%)
(Pts)
(Close)
markets and had a day of heavy selling largely due to the political tension. North
Korea has renewed its threat to strike US base of Guam and market participants
Dow Jones
(0.9)
(205)
21,844
seems to be moving away from equities to more safer asset class like Gold.
Nasdaq
(2.1)
(135)
6,217
FTSE
(1.4)
(108)
7,390
Indian markets continued to lose ground and ended sharply lower during the day.
Nikkei
(0.0)
(9)
19,730
SEBI’s crack down on the shell companies and the ongoing tension in the Doklam
region continued to have a negative impact on the markets. With global markets
Hang Seng
(1.1)
(313)
27,444
remaining weak the Indian markets could also continue to remain under pressure in
Shanghai Com
(0.4)
(14)
3,262
the near term.
Advances / Declines
BSE
NSE
News Analysis
Advances
317
186
Philips carbon black to invest `300 cr to ramp up capacity
Declines
2,277
1,532
Detailed analysis is on Pg2
Unchanged
107
33
Investor’s Ready Reckoner
Key Domestic & Global Indicators
Volumes (` Cr)
Stock Watch: Latest investment recommendations on 150+ stocks
BSE
4,589
Refer Pg7 onwards
NSE
31,696
Top Picks
CMP
Target
Upside
#Net Inflows (` Cr)
Net
Mtd
Ytd
Company
Sector
Rating
(`)
(`)
(%)
FII
1,898
567
58,963
Blue Star
Capital Goods
Buy
659
760
15.4
MFs
648
4,002
54,948
Dewan Housing FinanceFinancials
Buy
406
550
35.4
Mahindra Lifespace
Real Estate
Buy
413
522
26.5
Navkar Corporation
Others
Buy
185
265
43.4
Top Gainers
Price (`)
Chg (%)
KEI Industries
Capital Goods
Buy
215
258
19.8
Srf
1,476
2.8
More Top Picks on Pg5
Techm
404
2.7
Key Upcoming Events
Kajariacer
636
2.3
Previous
Consensus
Date
Region
Event Description
Reading
Expectations
Vakrangee
448
1.5
Aug 11, 2017 UK
Industrial Production (YoY)
0.30
(0.10)
Britannia
4,119
1.4
Aug 11, 2017 India
Industrial Production YoY
1.70
0.10
Aug 14, 2017 China
Industrial Production (YoY)
7.60
7.10
Top Losers
Price (`)
Chg (%)
Aug 14, 2017 India
Imports YoY%
19.00
Natcopharm
697
(16.1)
Aug 14, 2017 India
Exports YoY%
4.40
More Events on Pg7
Kscl
532
(12.6)
Bomdyeing
70
(11.0)
Symphony
1,202
(9.8)
Welcorp
113
(9.6)
#as on 10rd Aug, 2017
Market Outlook
August 11, 2017
News Analysis
Philip carbon black to invest ` 300 cr to ramp up capacity:
Philips carbon black Ltd plans to invest `300 cr to ramp up capacity, the company
was also evaluating a greenfield carbon black plant in south India.The company
have a capacity of 4.8 lakh tonne per annum of carbon black and now plans to
invest `300 cr in Palej and Mundra plants of of Gujarat to add another 80,000
tonne of capacity. The company said the new plant will be ready by FY2019. The
company says it is also evaluating a green field capacity of 1.2 lakh tonne in South
India. The company says it is looking for either Tamil Nadu or either Andhra
Pradesh and the final call be taken by the key factors like location of new tyre
capacity and state incentive says the company. The company says the green field
project is in a formative stage and which should get ready in the next few months
and then the quantum will be estimated. Though, specialty black is gaining ground
but new capacity in Gujarat will be normal carbon black. Specialty carbon
production can be carried out in a manufacturing facilities.
Economic and Political News
Tax to GDP ratio may rise to 11.9% due to GST
Govt projects 26% rise in capex over next two years
RBI halves dividend payout to Govt to `30,659 cr
Corporate News
SAT stays SEBI’s order against J Kumar Infra and Prakash Industries
Tata Motors & Vokswagen’s Skoda Auto call off tie up even before it could
start
Spice Jet Q1FY18 rises 18% due to higher airfares
NCLT admits insolvency process dings against Lanco Infratech
Market Outlook
August 11, 2017
Quarterly Bloomberg Brokers Consensus Estimate
Hindalco Industries Ltd - Aug 11, 2017
Particulars (`cr)
1QFY18E
1QFY17
y-o-y (%)
4QFY17
q-o-q (%)
Net sales
10,113
7,501
34.8
11,026
(8.3)
EBITDA
1,252
1,232
1.7
1,347
(7.0)
EBITDA margin (%)
12.4
16.4
12.2
Net profit
408
294
38.7
503
(18.9)
Bosch Ltd - Aug 11, 2017
Particulars (`cr)
1QFY18E
1QFY17
y-o-y (%)
4QFY17
q-o-q (%)
Net sales
2,693
2,362
14.0
2,476
8.8
EBITDA
482
433
11.5
451
6.9
EBITDA margin (%)
17.9
18.3
18.2
Net profit
369
305
20.8
379
(2.6)
Bharat Petroleum Corp Ltd - Aug 11, 2017
Particulars (`cr)
1QFY18E
1QFY17
y-o-y (%)
4QFY17
q-o-q (%)
Net sales
54,288
46,890
15.8
57,036
(4.8)
EBITDA
1,989
4,085
(51.3)
2,212
(10.1)
EBITDA margin (%)
3.7
8.7
3.9
Net profit
1,250
2,621
(52.3)
1,842
(32.1)
Cadila Healthcare Consol - Aug 11, 2017
Particulars (`cr)
1QFY18E
1QFY17
y-o-y (%)
4QFY17
q-o-q (%)
Net sales
2,543
2,216
14.7
2,418
5.2
EBITDA
523
524
(0.3)
464
12.7
EBITDA margin (%)
20.5
23.6
19.2
Net profit
344
356
(3.5)
386
(10.8)
State Bank of India - Aug 11, 2017
Particulars (`cr)
1QFY18E
1QFY17
y-o-y (%)
4QFY17
q-o-q (%)
Net profit
2,883
2,521
14.4
2,815
2.4
Bank of Baroda - Aug 11, 2017
Particulars (`cr)
1QFY18E
1QFY17
y-o-y (%)
4QFY17
q-o-q (%)
Net profit
506
424
19.5
155
227.2
Market Outlook
August 11, 2017
Tata Global Beverages Ltd Consol - Aug 11, 2017
Particulars ( `cr)
1QFY18E
1QFY17
y-o-y (%)
4QFY17 q-o-q (%)
Net sales
1,756
1,711
2.6
1,674
4.9
EBITDA
223
238
(6.6)
179
24.5
EBITDA margin (%)
12.7
13.9
10.7
Net profit
97
104
(6.7)
51
89.2
Market Outlook
August 11, 2017
Top Picks HHHHH
Market Cap
CMP
Target
Upside
Company
Rationale
(` Cr)
(`)
(`)
(%)
Strong growth in domestic business due to its leadership
in acute therapeutic segment. Alkem expects to launch
Alkem Laboratories
20,668
1,729
2,161
25.0
more products in USA, which bodes for its international
business.
We expect the company would report strong profitability
Asian Granito
1,205
401
480
19.8
owing to better product mix, higher B2C sales and
amalgamation synergy.
Favorable outlook for the AC industry to augur well for
Cooling products business which is out pacing the
Blue Star
6,308
659
760
15.4
market growth. EMPPAC division's profitability to improve
once operating environment turns around.
With a focus on the low and medium income (LMI)
consumer segment, the company has increased its
Dewan Housing Finance
12,741
406
550
35.4
presence in tier-II & III cities where the growth
opportunity is immense.
Loan growth is likely to pick up after a sluggish FY17.
Karur Vysya Bank
8,098
134
160
19.4
Lower credit cost will help in strong bottom-line growth.
Increasing share of CASA will help in NIM improvement.
High order book execution in EPC segment, rising B2C
KEI Industries
1,676
215
258
19.8
sales and higher exports to boost the revenues and
profitability
Speedier execution and speedier sales, strong revenue
Mahindra Lifespace
2,117
413
522
26.5
visibility in short-to-long run, attractive valuations
Expected to benefit from the lower capex requirement
Music Broadcast
2,009
350
434
24.0
and 15 year long radio broadcast licensing.
Massive capacity expansion along with rail advantage at
Navkar Corporation
2,636
185
265
43.4
ICD as well CFS augurs well for the company
Strong brands and distribution network would boost
Siyaram Silk Mills
1,866
1,991
2,500
25.6
growth going ahead. Stock currently trades at an
inexpensive valuation.
Market leadership in Hindi news genre and no.
2
viewership ranking in English news genre, exit from the
TV Today Network
1,291
216
344
58.9
radio business, and anticipated growth in ad spends by
corporates to benefit the stock.
After GST, the company is expected to see higher
volumes along with improving product mix. The Gujarat
Maruti Suzuki
2,28,990
7,580
8,495
12.1
plant will also enable higher operating leverage which
will be margin accretive.
Source: Company, Angel Research
Market Outlook
August 11, 2017
Key Upcoming Events
Result Calendar
Date
Company
Tata Global, Bosch India, TVS Motor, Crompton Greaves, Suzlon Energy, BGR Energy , Blue Star, St Bk of
August 11, 2017
India, Bank of Baroda
August 12, 2017
United Bank, Godawari Ispat, TVS Srichakra, DLF
Source: Bloomberg, Angel Research
Global economic events release calendar
Bloomberg Data
Date
Time
Country
Event Description
Unit
Period
Last Reported
Estimated
Aug 11, 2017
2:00 PMUK
Industrial Production (YoY)
% Change
Jun
0.30
(0.10)
5:30 PMIndia
Industrial Production YoY
% Change
Jun
1.70
0.10
Aug 14, 2017
7:30 AMChina
Industrial Production (YoY)
% Change
Jul
7.60
7.10
India
Imports YoY%
% Change
Jul
19.00
India
Exports YoY%
% Change
Jul
4.40
12:00 PMIndia
Monthly Wholesale Prices YoY%
% Change
Jul
0.90
1.40
Aug 15, 2017
2:00 PMUK
CPI (YoY)
% Change
Jul
2.60
2.70
11:30 AMGermany GDP nsa (YoY)
% Change
2Q P
2.90
Aug 16, 2017
2:30 PMEuro Zone Euro-Zone GDP s.a. (QoQ)
% Change
2Q P
0.60
6:00 PMUS
Housing Starts
Thousands
Jul
1,215.00
1,225.00
6:00 PMUS
Building permits
Thousands
Jul
1,275.00
1,240.00
2:00 PMUK
Jobless claims change
% Change
Jul
5.90
Aug 17, 2017
2:30 PMEuro Zone Euro-Zone CPI (YoY)
%
Jul F
1.30
6:45 PMUS
Industrial Production
%
Jul
0.39
0.20
Aug 23, 2017
1:00 PMGermany PMI Manufacturing
Value
Aug P
58.10
Source: Bloomberg, Angel Research
Market Outlook
August 11, 2017
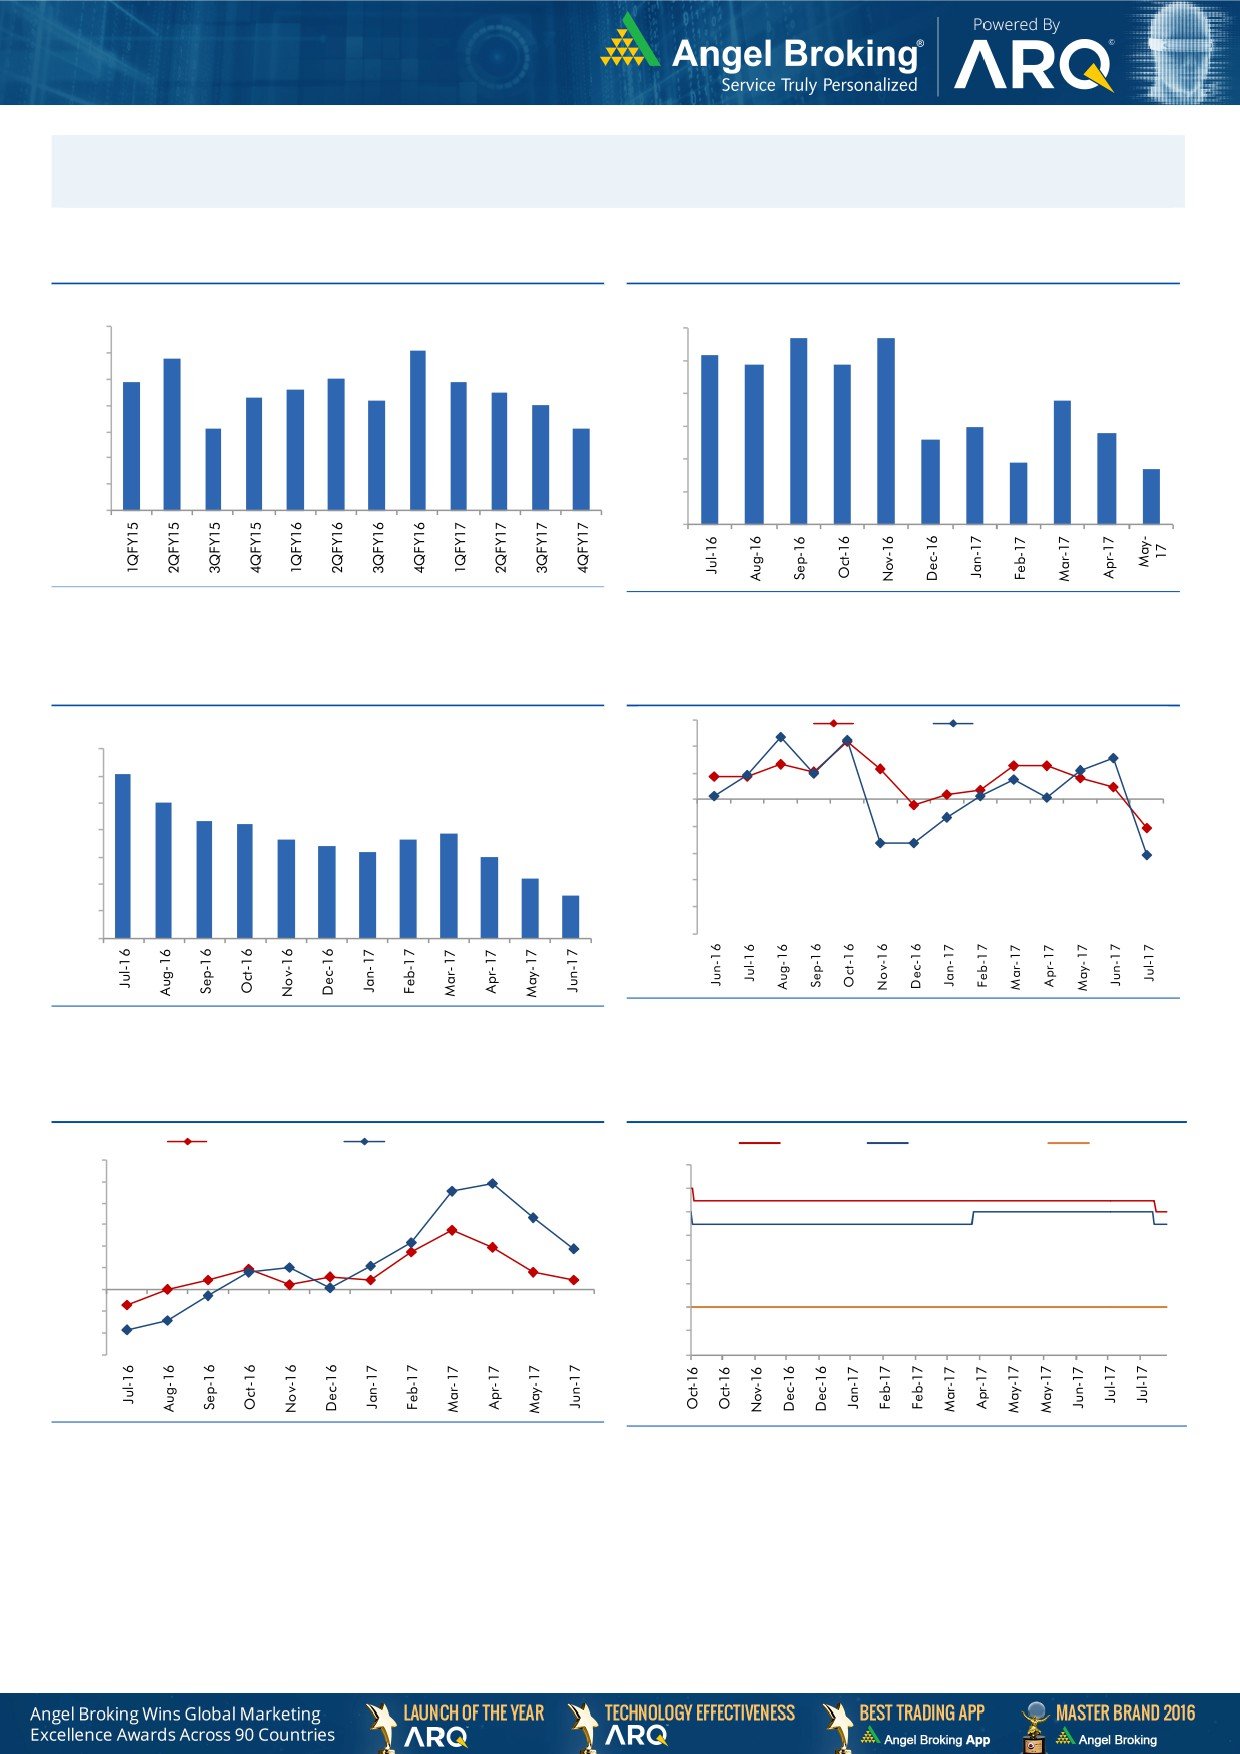
Macro watch
Exhibit 1: Quarterly GDP trends
Exhibit 2: IIP trends
(%)
(%)
5.7
5.7
10.0
6.0
9.1
5.2
8.8
4.9
4.9
9.0
7.9
8.0
7.9
5.0
7.6
7.5
8.0
7.3
7.2
3.8
7.0
4.0
7.0
6.1
6.1
3.0
2.8
3.0
2.6
6.0
1.9
1.7
5.0
2.0
4.0
1.0
3.0
-
Source: CSO, Angel Research
Source: MOSPI, Angel Research
Exhibit 3: Monthly CPI inflation trends
Exhibit 4: Manufacturing and services PMI
56.0
Mfg. PMI
Services PMI
(%)
7.0
54.0
6.1
6.0
52.0
5.1
5.0
4.3
50.0
4.2
3.9
3.6
3.7
4.0
3.4
48.0
3.2
3.0
46.0
3.0
2.2
1.5
44.0
2.0
42.0
1.0
-
40.0
Source: Market, Angel Research; Note: Level above 50 indicates expansion
Source: MOSPI, Angel Research
Exhibit 5: Exports and imports growth trends
Exhibit 6: Key policy rates
(%)
Exports yoy growth
Imports yoy growth
(%)
Repo rate
Reverse Repo rate
CRR
60.0
7.00
50.0
6.50
40.0
6.00
30.0
5.50
20.0
5.00
10.0
4.50
0 .0
(10.0)
4.00
(20.0)
3.50
(30.0)
3.00
Source: Bloomberg, Angel Research
Source: RBI, Angel Research
Market Outlook
August 11, 2017
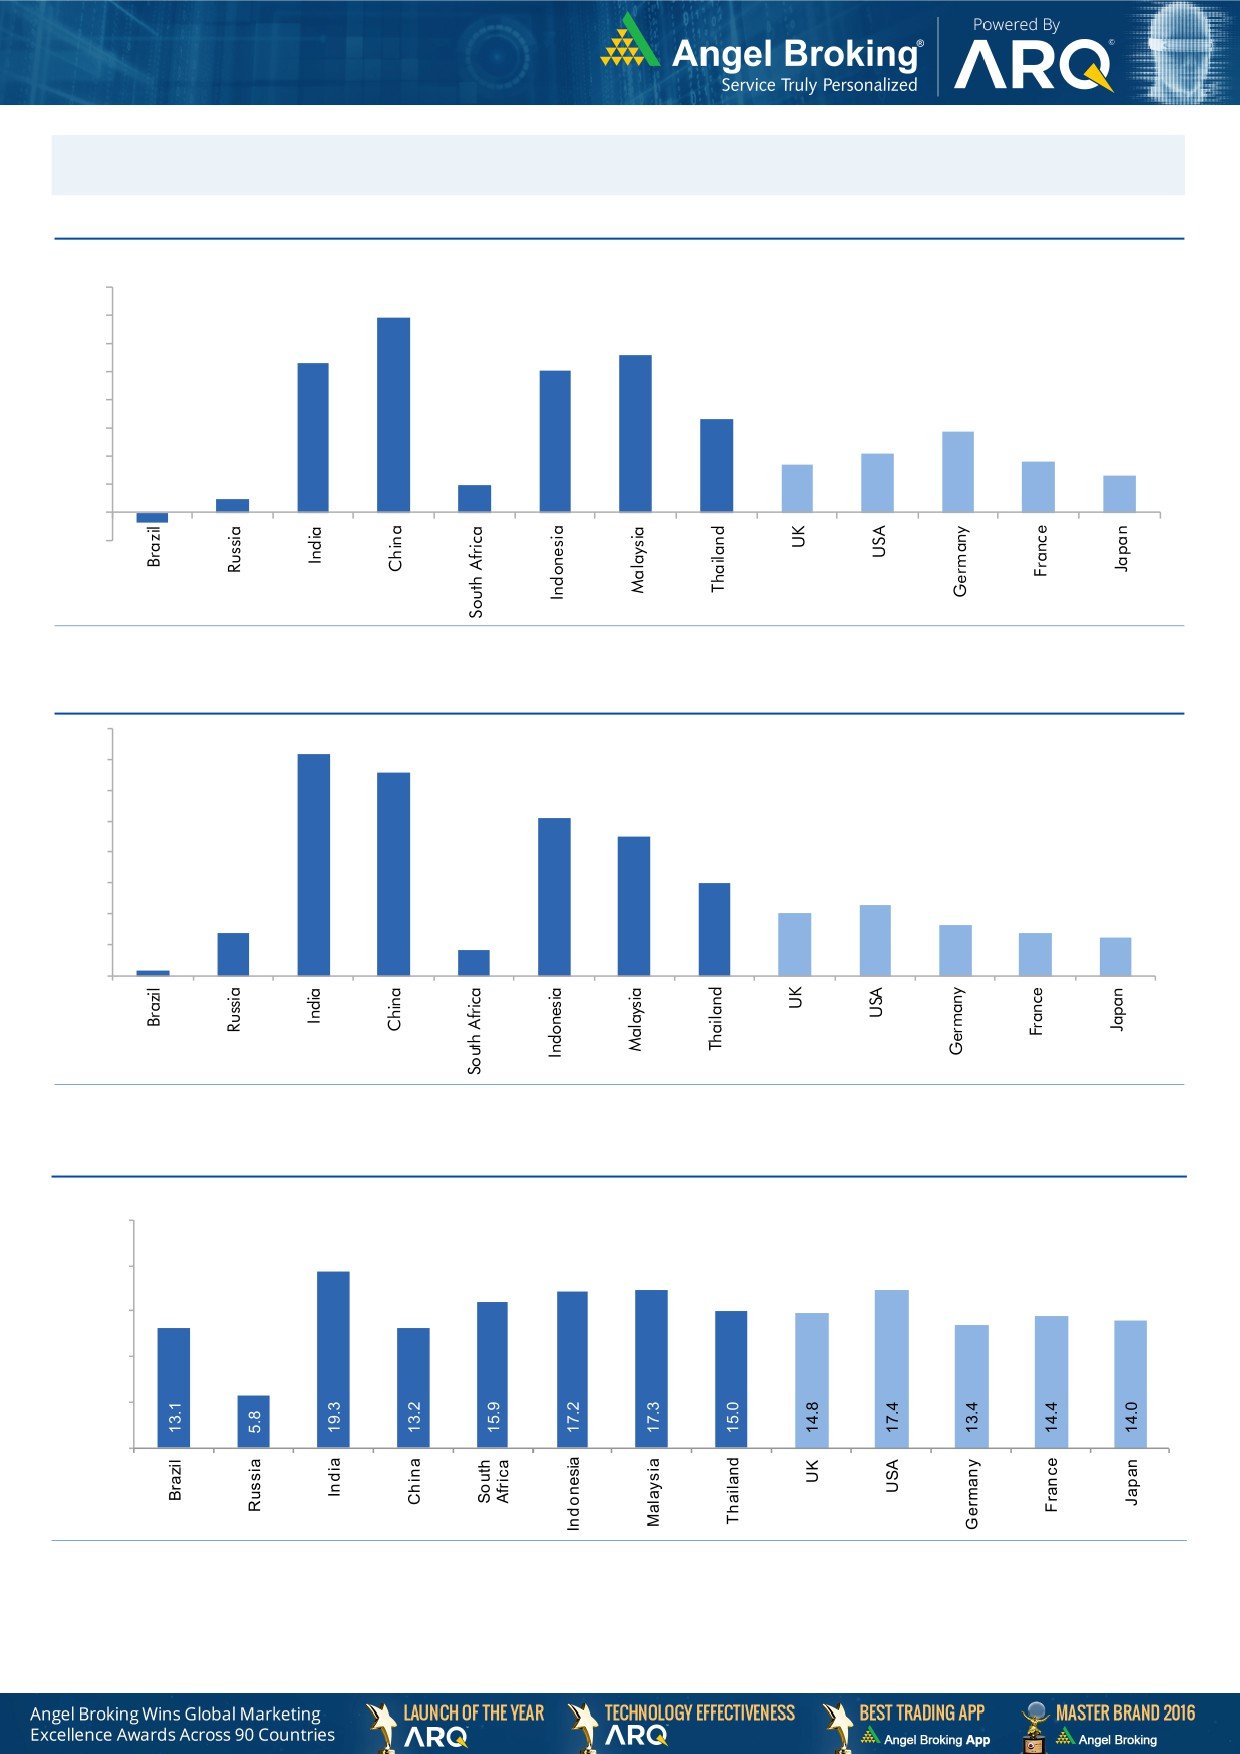
Global watch
Exhibit 1: Latest quarterly GDP Growth (%, yoy) across select developing and developed countries
(%)
8.0
6.9
7.0
5.6
6.0
5.3
5.0
1.0
5.0
4.0
3.3
2.9
3.0
2.1
0.5
1.7
1.8
2.0
1.3
1.0
-
(1.0)
(0.4)
Source: Bloomberg, Angel Research
Exhibit 2: 2016 GDP Growth projection by IMF (%, yoy) across select developing and developed countries
(%)
7.2
6.6
7.0
6.0
5.1
5.0
4.5
4.0
3.0
3.0
2.3
2.0
1.4
1.6
2.0
1.4
1.2
0.2
0.8
1.0
-
Source: IMF, Angel Research
Exhibit 3: One year forward P-E ratio across select developing and developed countries
(x)
25.0
20.0
15.0
10.0
5.0
-
Source: IMF, Angel Research
Market Outlook
August 11, 2017
Exhibit 4: Relative performance of indices across globe
Returns (%)
Country
Name of index
Closing price
1M
3M
1YR
Brazil
Bovespa
66,992
5.0
(0.8)
16.2
Russia
Micex
1,960
1.2
(2.1)
(0.4)
India
Nifty
9,820
0.3
4.2
13.1
China
Shanghai Composite
3,262
1.1
5.6
9.5
South Africa
Top 40
49,303
7.2
3.5
8.3
Mexico
Mexbol
50,907
0.8
3.0
5.3
Indonesia
LQ45
968
(1.8)
1.9
4.9
Malaysia
KLCI
1,778
1.3
0.5
7.8
Thailand
SET 50
1,000
0.8
0.7
4.9
USA
Dow Jones
21,844
2.0
4.3
17.4
UK
FTSE
7,390
0.8
0.0
6.9
Japan
Nikkei
19,730
(1.7)
(1.2)
22.7
Germany
DAX
12,014
(3.4)
(5.5)
12.5
France
CAC
5,115
(0.5)
(5.4)
15.3
Source: Bloomberg, Angel Research
Stock Watch
August 11, 2017
Company Name
Reco
CMP
Target
Mkt Cap
Sales ( Čcr )
OPM(%)
EPS (Č)
PER(x)
P/BV(x)
RoE(%)
EV/Sales(x)
(Č)
Price ( Č)
( Č cr )
FY17E FY18E
FY17E
FY18E
FY17E
FY18E
FY17E
FY18E
FY17E
FY18E
FY17E
FY18E
FY17E
FY18E
Agri / Agri Chemical
Rallis
Reduce
226
209
4,404
1,937
2,164
13.3
14.3
9.0
11.0
25.2
20.6
4.4
3.8
18.4
19.8
2.3
2.0
United Phosphorus
Neutral
821
-
41,722
15,176
17,604
18.5
18.5
37.4
44.6
22.0
18.4
4.3
3.6
21.4
21.2
2.9
2.4
Auto & Auto Ancillary
Ashok Leyland
Accumulate
103
116
30,231
20,019
22,789
11.1
11.7
4.3
5.5
24.0
18.9
4.7
4.2
19.4
22.0
1.5
1.3
Bajaj Auto
Neutral
2,795
-
80,872
25,093
27,891
19.5
19.2
143.9
162.5
19.4
17.2
5.5
4.7
30.3
29.4
3.0
2.6
Bharat Forge
Neutral
1,142
-
26,591
7,726
8,713
20.5
21.2
35.3
42.7
32.4
26.8
6.0
5.4
18.9
20.1
3.5
3.1
Eicher Motors
Neutral
30,112
-
81,970
16,583
20,447
17.5
18.0
598.0
745.2
50.4
40.4
17.2
13.1
41.2
38.3
4.8
3.8
Gabriel India
Neutral
163
-
2,334
1,544
1,715
9.0
9.3
5.4
6.3
30.1
25.8
5.7
5.0
18.9
19.5
1.5
1.3
Hero Motocorp
Neutral
3,887
-
77,620
28,120
30,753
15.2
15.6
169.1
189.2
23.0
20.5
7.9
6.6
30.8
28.2
2.6
2.3
Jamna Auto Industries Neutral
265
-
2,112
1,486
1,620
9.8
9.9
15.0
17.2
17.7
15.4
3.9
3.3
21.8
21.3
1.5
1.4
L G Balakrishnan & Bros Neutral
711
-
1,116
1,302
1,432
11.6
11.9
43.7
53.0
16.3
13.4
2.3
2.1
13.8
14.2
0.9
0.9
Mahindra and Mahindra Neutral
1,389
-
86,295
46,534
53,077
11.6
11.7
67.3
78.1
20.6
17.8
3.4
2.9
15.4
15.8
1.8
1.6
Maruti
Accumulate
7,580
8,495
228,990
67,822
83,717
15.2
15.0
243.0
291.5
31.2
26.0
7.1
5.8
22.9
22.4
3.1
2.4
Minda Industries
Neutral
757
-
6,544
2,728
3,042
9.0
9.1
68.2
86.2
11.1
8.8
2.5
2.0
23.8
24.3
2.5
2.2
Motherson Sumi
Neutral
318
-
66,839
45,896
53,687
7.8
8.3
13.0
16.1
24.3
19.7
7.9
6.3
34.7
35.4
1.5
1.3
Rane Brake Lining
Neutral
1,197
-
947
511
562
11.3
11.5
28.1
30.9
42.6
38.7
6.5
5.9
15.3
15.0
2.0
1.8
Setco Automotive
Neutral
36
-
483
741
837
13.0
13.0
15.2
17.0
2.4
2.1
0.4
0.4
15.8
16.3
1.0
0.9
Tata Motors
Neutral
381
-
109,979
300,209
338,549
8.9
8.4
42.7
54.3
8.9
7.0
1.4
1.2
15.6
17.2
0.5
0.4
TVS Motor
Neutral
578
-
27,474
13,390
15,948
6.9
7.1
12.8
16.5
45.3
35.0
11.3
8.9
26.3
27.2
2.1
1.7
Amara Raja Batteries
Buy
799
962
13,645
5,339
6,220
15.9
15.3
28.0
32.3
28.5
24.7
5.4
4.6
19.1
18.5
2.6
2.2
Exide Industries
Neutral
200
-
16,996
7,439
8,307
15.0
15.0
8.1
9.3
24.7
21.5
3.5
3.1
14.3
16.7
1.9
1.7
Apollo Tyres
Neutral
262
-
13,357
12,877
14,504
14.3
13.9
21.4
23.0
12.2
11.4
1.9
1.7
16.4
15.2
1.2
1.1
Ceat
Neutral
1,695
-
6,855
7,524
8,624
13.0
12.7
131.1
144.3
12.9
11.7
2.4
2.0
19.8
18.6
1.0
0.9
JK Tyres
Neutral
149
-
3,386
7,455
8,056
15.0
15.0
21.8
24.5
6.9
6.1
1.4
1.2
22.8
21.3
0.6
0.5
Swaraj Engines
Neutral
1,975
-
2,453
660
810
15.2
16.4
54.5
72.8
36.2
27.1
11.3
10.3
31.5
39.2
3.5
2.9
Subros
Neutral
228
-
1,365
1,488
1,681
11.7
11.9
6.4
7.2
35.6
31.8
3.8
3.4
10.8
11.4
1.2
1.0
Indag Rubber
Neutral
179
-
471
286
326
19.8
16.8
11.7
13.3
15.3
13.5
2.6
2.4
17.8
17.1
1.3
1.1
Capital Goods
ACE
Neutral
60
-
597
709
814
4.1
4.6
1.4
2.1
43.1
28.7
1.8
1.7
4.4
6.0
1.0
0.9
BEML
Neutral
1,489
-
6,199
3,451
4,055
6.3
9.2
31.4
57.9
47.4
25.7
2.9
2.6
6.3
10.9
1.9
1.6
Bharat Electronics
Neutral
171
-
38,139
8,137
9,169
16.8
17.2
58.7
62.5
2.9
2.7
0.5
0.4
44.6
46.3
3.7
3.3
Stock Watch
August 11, 2017
Company Name
Reco
CMP
Target
Mkt Cap
Sales ( Čcr )
OPM(%)
EPS (Č)
PER(x)
P/BV(x)
RoE(%)
EV/Sales(x)
(Č)
Price ( Č)
( Č cr )
FY17E
FY18E
FY17E
FY18E
FY17E
FY18E
FY17E
FY18E
FY17E
FY18E
FY17E
FY18E
FY17E
FY18E
Capital Goods
Voltas
Neutral
520
-
17,213
6,511
7,514
7.9
8.7
12.9
16.3
40.3
31.9
7.3
6.4
16.7
18.5
2.4
2.0
BGR Energy
Neutral
129
-
931
16,567
33,848
6.0
5.6
7.8
5.9
16.5
21.9
0.9
0.9
4.7
4.2
0.2
0.1
BHEL
Neutral
126
-
30,950
28,797
34,742
-
2.8
2.3
6.9
55.0
18.3
0.9
0.9
1.3
4.8
0.7
0.5
Blue Star
Buy
659
760
6,308
4,283
5,077
5.9
7.3
14.9
22.1
44.3
29.8
8.6
7.2
20.4
26.4
1.5
1.3
CG Power and Industrial
Neutral
72
-
4,525
5,777
6,120
5.9
7.0
3.3
4.5
21.9
16.0
1.0
0.9
4.4
5.9
0.7
0.6
Solutions
Greaves Cotton
Neutral
150
-
3,659
1,755
1,881
16.8
16.9
7.8
8.5
19.2
17.6
3.8
3.6
20.6
20.9
1.8
1.6
Inox Wind
Neutral
118
-
2,621
5,605
6,267
15.7
16.4
24.8
30.0
4.8
3.9
1.3
1.0
25.9
24.4
0.5
0.4
KEC International
Neutral
289
-
7,432
9,294
10,186
7.9
8.1
9.9
11.9
29.2
24.3
4.3
3.7
15.6
16.3
1.0
0.9
KEI Industries
Buy
215
258
1,676
2,633
3,001
10.4
10.0
12.7
13.0
16.9
16.6
3.6
3.0
21.4
18.2
0.8
0.7
Thermax
Neutral
864
-
10,300
5,421
5,940
7.3
7.3
25.7
30.2
33.6
28.6
4.1
3.7
12.2
13.1
1.8
1.6
VATech Wabag
Accumulate
613
681
3,346
3,136
3,845
8.9
9.1
26.0
35.9
23.6
17.1
3.0
2.5
13.4
15.9
1.0
0.8
Cement
ACC
Neutral
1,776
-
33,358
11,225
13,172
13.2
16.9
44.5
75.5
39.9
23.5
3.8
3.5
11.2
14.2
3.0
2.5
Ambuja Cements
Neutral
268
-
53,126
9,350
10,979
18.2
22.5
5.8
9.5
46.1
28.2
3.9
3.5
10.2
12.5
5.7
4.8
India Cements
Neutral
174
-
5,371
4,364
4,997
18.5
19.2
7.9
11.3
22.1
15.4
1.6
1.5
8.0
8.5
2.0
1.7
JK Cement
Neutral
1,017
-
7,107
4,398
5,173
15.5
17.5
31.2
55.5
32.6
18.3
3.9
3.4
12.0
15.5
2.2
1.8
J K Lakshmi Cement
Neutral
419
-
4,930
2,913
3,412
14.5
19.5
7.5
22.5
55.9
18.6
3.4
2.9
12.5
18.0
2.3
1.9
Orient Cement
Neutral
153
-
3,140
2,114
2,558
18.5
20.5
8.1
11.3
18.9
13.6
2.8
2.4
9.0
14.0
2.1
1.6
UltraTech Cement
Neutral
3,912
-
107,399
25,768
30,385
21.0
23.5
111.0
160.0
35.2
24.5
4.5
3.9
13.5
15.8
4.3
3.6
Construction
ITNL
Neutral
76
-
2,510
8,946
10,017
31.0
31.6
8.1
9.1
9.4
8.4
0.4
0.4
4.2
5.0
3.6
3.4
KNR Constructions
Neutral
203
-
2,859
1,385
1,673
14.7
14.0
41.2
48.5
4.9
4.2
0.9
0.8
14.9
15.2
2.1
1.8
Larsen & Toubro
Buy
1,160
1,700
162,364
111,017
124,908
11.0
11.0
61.1
66.7
19.0
17.4
2.3
2.1
13.1
12.9
2.5
2.3
Gujarat Pipavav Port
Neutral
136
-
6,563
705
788
52.2
51.7
5.0
5.6
27.2
24.2
2.7
2.4
11.2
11.2
9.0
7.5
Nagarjuna Const.
Neutral
82
-
4,578
8,842
9,775
9.1
8.8
5.3
6.4
15.5
12.9
1.2
1.1
8.2
9.1
0.7
0.6
PNC Infratech
Neutral
137
-
3,511
2,350
2,904
13.1
13.2
9.0
8.8
15.2
15.6
0.6
0.5
15.9
13.9
1.6
1.3
Simplex Infra
Neutral
467
-
2,311
6,829
7,954
10.5
10.5
31.4
37.4
14.9
12.5
1.5
1.4
9.9
13.4
0.8
0.6
Power Mech Projects
Neutral
543
-
798
1,801
2,219
12.7
14.6
72.1
113.9
7.5
4.8
1.4
1.2
16.8
11.9
0.4
0.3
Sadbhav Engineering
Accumulate
279
298
4,779
3,598
4,140
10.3
10.6
9.0
11.9
31.0
23.4
3.2
2.8
9.9
11.9
1.6
1.4
NBCC
Neutral
195
-
17,555
7,428
9,549
7.9
8.6
8.2
11.0
23.8
17.7
1.2
0.9
28.2
28.7
2.1
1.6
MEP Infra
Neutral
102
-
1,662
1,877
1,943
30.6
29.8
3.0
4.2
34.1
24.4
16.5
11.1
0.6
0.6
2.3
2.1
Stock Watch
August 11, 2017
Company Name
Reco
CMP
Target
Mkt Cap
Sales ( Čcr )
OPM(%)
EPS (Č)
PER(x)
P/BV(x)
RoE(%)
EV/Sales(x)
(Č)
Price ( Č)
( Č cr )
FY17E
FY18E
FY17E
FY18E
FY17E
FY18E
FY17E
FY18E
FY17E
FY18E
FY17E
FY18E
FY17E
FY18E
Construction
SIPL
Neutral
102
-
3,602
1,036
1,252
65.5
66.2
(8.4)
(5.6)
3.8
4.4
(22.8)
(15.9)
11.7
9.7
Engineers India
Neutral
146
-
9,859
1,725
1,935
16.0
19.1
11.4
13.9
12.8
10.5
1.8
1.7
13.4
15.3
4.6
4.2
Financials
Axis Bank
Buy
487
580
116,721
46,932
53,575
3.5
3.4
32.4
44.6
15.1
10.9
1.9
1.7
13.6
16.5
-
-
Bank of Baroda
Neutral
148
-
34,182
19,980
23,178
1.8
1.8
11.5
17.3
12.9
8.6
1.5
1.2
8.3
10.1
-
-
Canara Bank
Neutral
330
-
19,708
15,225
16,836
1.8
1.8
14.5
28.0
22.8
11.8
1.6
1.3
5.8
8.5
-
-
Can Fin Homes
Neutral
2,832
-
7,540
420
526
3.5
3.5
86.5
107.8
32.7
26.3
7.1
5.8
23.6
24.1
-
-
Cholamandalam Inv. &
Accumulate
1,159
1,230
18,114
2,012
2,317
6.3
6.3
42.7
53.6
27.1
21.6
4.3
3.7
16.9
18.3
-
-
Fin. Co.
Dewan Housing Finance Buy
406
550
12,741
2,225
2,688
2.9
2.9
29.7
34.6
13.7
11.7
2.2
1.5
16.1
14.8
-
-
Equitas Holdings
Buy
154
235
5,212
939
1,281
11.7
11.5
5.8
8.2
26.5
18.8
2.3
2.0
10.9
11.5
-
-
Federal Bank
Buy
105
140
20,418
8,259
8,995
3.0
3.0
4.3
5.6
24.4
18.8
2.1
1.9
8.5
10.1
-
-
HDFC
Neutral
1,703
-
271,190
11,475
13,450
3.4
3.4
45.3
52.5
37.6
32.4
7.2
6.4
20.2
20.5
-
-
HDFC Bank
Accumulate
1,760
1,850
453,148
46,097
55,433
4.5
4.5
58.4
68.0
30.1
25.9
5.3
4.4
18.8
18.6
-
-
ICICI Bank
Buy
289
335
185,171
42,800
44,686
3.1
3.3
18.0
21.9
16.0
13.2
2.2
2.0
11.1
12.3
-
-
Karur Vysya Bank
Buy
134
160
8,098
5,640
6,030
3.3
3.2
8.9
10.0
15.1
13.4
1.6
1.5
11.2
11.4
-
-
Lakshmi Vilas Bank
Neutral
172
-
3,297
3,339
3,799
2.7
2.8
11.0
14.0
15.6
12.3
1.6
1.5
11.2
12.7
-
-
LIC Housing Finance
Neutral
657
-
33,174
3,712
4,293
2.6
2.5
39.0
46.0
16.9
14.3
3.2
2.7
19.9
20.1
-
-
Punjab Natl.Bank
Neutral
143
-
30,515
23,532
23,595
2.3
2.4
6.8
12.6
21.1
11.4
3.3
2.3
3.3
6.5
-
-
RBL Bank
Neutral
490
-
18,599
1,783
2,309
2.6
2.6
12.7
16.4
38.6
29.9
4.2
3.8
12.8
13.3
-
-
Repco Home Finance
Buy
641
825
4,010
388
457
4.5
4.2
30.0
38.0
21.4
16.9
3.6
3.0
18.0
19.2
-
-
South Ind.Bank
Neutral
26
-
4,716
6,435
7,578
2.5
2.5
2.7
3.1
9.7
8.4
1.3
1.1
10.1
11.2
-
-
St Bk of India
Accumulate
297
335
255,983
88,650
98,335
2.6
2.6
13.5
18.8
22.0
15.8
2.1
1.8
7.0
8.5
-
-
Union Bank
Neutral
134
-
9,243
13,450
14,925
2.3
2.3
25.5
34.5
5.3
3.9
0.8
0.7
7.5
10.2
-
-
Yes Bank
Neutral
1,730
-
79,153
8,978
11,281
3.3
3.4
74.0
90.0
23.4
19.2
4.4
3.8
17.0
17.2
-
-
FMCG
Akzo Nobel India
Neutral
1,764
-
8,459
2,955
3,309
13.3
13.7
57.2
69.3
30.9
25.4
10.1
8.5
32.7
33.3
2.7
2.3
Asian Paints
Neutral
1,152
-
110,524
17,128
18,978
16.8
16.4
19.1
20.7
60.3
55.7
21.0
19.8
34.8
35.5
6.4
5.7
Britannia
Neutral
4,119
-
49,454
9,594
11,011
14.6
14.9
80.3
94.0
51.3
43.8
21.1
16.3
41.2
-
5.0
4.3
Colgate
Neutral
1,051
-
28,584
4,605
5,149
23.4
23.4
23.8
26.9
44.2
39.1
24.4
19.1
64.8
66.8
6.1
5.5
Dabur India
Neutral
306
-
53,894
8,315
9,405
19.8
20.7
8.1
9.2
37.8
33.3
10.5
8.7
31.6
31.0
6.1
5.4
GlaxoSmith Con*
Neutral
5,400
-
22,710
4,350
4,823
21.2
21.4
179.2
196.5
30.1
27.5
8.0
6.8
27.1
26.8
4.6
4.1
Stock Watch
August 11, 2017
Company Name
Reco
CMP
Target
Mkt Cap
Sales ( Čcr )
OPM(%)
EPS (Č)
PER(x)
P/BV(x)
RoE(%)
EV/Sales(x)
(Č)
Price ( Č)
( Č cr )
FY17E FY18E
FY17E
FY18E
FY17E
FY18E
FY17E
FY18E
FY17E
FY18E
FY17E
FY18E
FY17E
FY18E
FMCG
Godrej Consumer
Neutral
901
-
61,407
10,235
11,428
18.4
18.6
41.1
44.2
21.9
20.4
4.9
4.1
24.9
24.8
6.1
5.4
HUL
Neutral
1,171
-
253,545
35,252
38,495
17.8
17.8
20.7
22.4
56.7
52.3
54.2
46.5
95.6
88.9
7.0
6.4
ITC
Neutral
273
-
332,447
40,059
44,439
38.3
39.2
9.0
10.1
30.4
27.0
8.5
7.4
27.8
27.5
7.8
7.0
Marico
Neutral
321
-
41,379
6,430
7,349
18.8
19.5
6.4
7.7
50.1
41.6
15.1
12.7
33.2
32.5
6.2
5.4
Nestle*
Neutral
6,632
-
63,946
10,073
11,807
20.7
21.5
124.8
154.2
53.1
43.0
21.8
19.6
34.8
36.7
6.2
5.2
Tata Global
Neutral
156
-
9,846
8,675
9,088
9.8
9.8
7.4
8.2
21.1
19.0
1.7
1.6
7.9
8.1
1.1
1.0
Procter & Gamble
Neutral
8,018
-
26,026
2,939
3,342
23.2
23.0
146.2
163.7
54.8
49.0
13.9
11.5
25.3
23.5
8.4
7.3
Hygiene
IT
HCL Tech^
Accumulate
883
1,014
126,067
46,723
52,342
22.1
20.9
60.0
62.8
14.7
14.1
3.7
3.2
25.3
22.4
2.4
2.1
Infosys
Buy
983
1,179
225,675
68,484
73,963
26.0
26.0
63.0
64.0
15.6
15.4
3.3
3.0
20.8
19.7
3.0
2.6
TCS
Accumulate
2,511
2,651
494,824
117,966
127,403
27.5
27.6
134.3
144.5
18.7
17.4
5.6
5.2
29.8
29.7
3.8
3.6
Tech Mahindra
Buy
404
533
39,408
29,141
31,051
14.4
15.0
32.3
35.6
12.5
11.4
2.1
1.9
17.1
17.0
1.2
1.1
Wipro
Neutral
288
-
140,153
55,421
58,536
20.3
20.3
35.1
36.5
8.2
7.9
1.4
1.2
19.2
14.6
1.9
1.7
Media
D B Corp
Neutral
370
-
6,812
2,297
2,590
27.4
28.2
21.0
23.4
17.6
15.8
4.1
3.6
23.7
23.1
2.8
2.4
HT Media
Neutral
83
-
1,936
2,693
2,991
12.6
12.9
7.9
9.0
10.5
9.2
0.9
0.8
7.8
8.3
0.3
0.2
Jagran Prakashan
Buy
172
225
5,638
2,283
2,555
28.0
28.0
10.6
12.3
16.2
14.1
3.5
3.0
21.4
21.4
2.5
2.2
Sun TV Network
Neutral
680
-
26,794
2,850
3,265
70.1
71.0
26.2
30.4
26.0
22.4
6.6
5.9
24.3
25.6
9.0
7.7
Hindustan Media
Neutral
267
-
1,958
1,016
1,138
24.3
25.2
27.3
30.1
9.8
8.9
1.9
1.7
16.2
15.8
1.3
1.1
Ventures
TV Today Network
Buy
216
344
1,291
608
667
21.5
22.3
15.7
19.2
13.8
11.3
2.1
1.8
16.1
16.0
1.7
1.5
Music Broadcast Limited Buy
350
434
1,999
271
317
91.0
109.0
6.0
10.0
58.4
35.0
3.7
3.3
6.5
9.3
7.0
5.7
Metals & Mining
Coal India
Neutral
239
-
148,388
84,638
94,297
21.4
22.3
24.5
27.1
9.8
8.8
4.1
3.9
42.6
46.0
1.3
1.1
Hind. Zinc
Neutral
280
-
118,478
14,252
18,465
55.9
48.3
15.8
21.5
17.8
13.0
2.9
2.5
17.0
20.7
8.3
6.4
Hindalco
Neutral
238
-
53,350
107,899
112,095
7.4
8.2
9.2
13.0
25.9
18.3
1.2
1.2
4.8
6.6
1.0
1.0
JSW Steel
Neutral
222
-
53,759
53,201
58,779
16.1
16.2
130.6
153.7
1.7
1.5
0.2
0.2
14.0
14.4
1.8
1.5
NMDC
Neutral
122
-
38,473
6,643
7,284
44.4
47.7
7.1
7.7
17.1
15.8
1.5
1.4
8.8
9.2
3.6
3.2
SAIL
Neutral
59
-
24,326
47,528
53,738
(0.7)
2.1
(1.9)
2.6
22.7
0.6
0.6
(1.6)
3.9
1.4
1.2
Vedanta
Neutral
299
-
111,070
71,744
81,944
19.2
21.7
13.4
20.1
22.3
14.9
1.9
1.7
8.4
11.3
1.9
1.6
Tata Steel
Neutral
605
-
58,715
121,374
121,856
7.2
8.4
18.6
34.3
32.5
17.6
2.0
1.9
6.1
10.1
1.1
1.1
Oil & Gas
GAIL
Neutral
364
-
61,530
56,220
65,198
9.3
10.1
27.1
33.3
13.4
10.9
1.2
1.1
9.3
10.7
1.3
1.1
ONGC
Neutral
164
-
210,080
137,222
152,563
15.0
21.8
19.5
24.1
8.4
6.8
0.7
0.7
8.5
10.1
1.8
1.6
Stock Watch
August 11, 2017
Company Name
Reco
CMP
Target
Mkt Cap
Sales ( Čcr )
OPM(%)
EPS (Č)
PER(x)
P/BV(x)
RoE(%)
EV/Sales(x)
(Č)
Price ( Č)
( Č cr )
FY17E FY18E
FY17E
FY18E
FY17E
FY18E
FY17E
FY18E
FY17E
FY18E
FY17E
FY18E
FY17E
FY18E
Oil & Gas
Indian Oil Corp
Neutral
410
-
199,238
373,359
428,656
5.9
5.5
54.0
59.3
7.6
6.9
1.2
1.1
16.0
15.6
0.7
0.6
Reliance Industries
Neutral
1,584
-
515,091
301,963
358,039
12.1
12.6
87.7
101.7
18.1
15.6
1.9
1.7
10.7
11.3
2.2
1.8
Pharmaceuticals
Alembic Pharma
Accumulate
524
600
9,881
3,101
3,966
19.7
20.5
21.4
25.5
24.5
20.6
5.2
4.2
23.0
22.8
3.2
2.3
Alkem Laboratories Ltd
Buy
1,729
2,161
20,668
5,853
6,901
17.1
18.4
74.6
85.0
23.2
20.3
4.9
4.1
21.1
20.2
3.5
3.0
Aurobindo Pharma
Buy
683
823
40,016
14,845
17,086
21.5
22.1
39.4
44.7
17.3
15.3
4.3
3.4
27.6
24.7
2.9
2.5
Aventis*
Neutral
4,160
-
9,581
2,206
2,508
16.6
16.8
128.9
139.9
32.3
29.7
5.5
4.3
21.6
23.5
4.1
3.4
Cadila Healthcare
Neutral
465
-
47,645
9,220
11,584
18.4
20.3
14.5
18.7
32.1
24.9
6.8
5.6
23.5
24.6
5.5
4.2
Cipla
Sell
549
461
44,169
14,281
16,619
15.4
16.2
12.5
19.7
43.9
27.9
3.5
3.2
8.4
12.0
3.3
2.8
Dr Reddy's
Neutral
1,949
-
32,305
14,081
15,937
16.1
18.6
72.6
105.9
26.9
18.4
2.6
2.4
9.6
13.6
2.5
2.2
Dishman Pharma
Sell
143
1,718
1,890
22.7
22.8
9.5
11.3
10.1
10.9
3.3
2.9
GSK Pharma*
Neutral
2,372
-
20,089
2,927
3,290
11.8
16.2
34.4
49.6
68.9
47.8
10.0
10.4
13.9
21.3
6.6
6.0
Indoco Remedies
Sell
192
153
1,773
1,067
1,154
12.1
14.9
8.4
11.3
22.9
17.0
2.7
2.4
12.6
15.0
1.9
1.7
Ipca labs
Buy
421
620
5,311
3,211
3,593
13.9
14.5
15.4
19.4
27.3
21.7
2.2
2.0
8.2
9.5
1.8
1.5
Lupin
Buy
936
1,467
42,268
17,120
18,657
24.1
24.1
56.9
61.1
16.4
15.3
3.1
2.6
20.7
18.6
2.8
2.2
Natco Pharma
Buy
696
1,060
12,127
2,065
1,988
33.1
33.7
27.9
25.7
24.9
27.1
7.3
6.2
29.2
22.9
6.0
6.0
Sun Pharma
Buy
460
712
110,401
30,264
32,899
29.0
26.9
32.7
31.6
14.1
14.6
3.0
2.6
22.2
18.7
3.4
3.0
Power
Tata Power
Neutral
77
-
20,746
36,916
39,557
17.4
27.1
5.1
6.3
15.0
12.2
1.3
1.2
9.0
10.3
1.6
1.4
NTPC
Neutral
173
-
142,523
86,605
95,545
17.5
20.8
11.8
13.4
14.7
12.9
1.5
1.4
10.5
11.1
3.0
3.0
Power Grid
Neutral
218
-
113,944
25,315
29,193
88.2
88.7
14.2
17.2
15.4
12.7
2.3
2.0
15.2
16.1
9.1
8.2
Real Estate
Prestige Estate
Neutral
250
-
9,386
4,707
5,105
25.2
26.0
10.3
13.0
24.3
19.3
2.0
1.8
10.3
10.2
3.2
2.8
MLIFE
Buy
413
522
2,117
1,152
1,300
22.7
24.6
29.9
35.8
13.8
11.5
1.0
1.0
7.6
8.6
2.6
2.2
Telecom
Bharti Airtel
Neutral
416
-
166,392
105,086
114,808
34.5
34.7
12.2
16.4
34.1
25.4
2.3
2.2
6.8
8.4
2.5
2.2
Idea Cellular
Neutral
88
-
31,702
40,133
43,731
37.2
37.1
6.4
6.5
13.7
13.5
1.1
1.1
8.2
7.6
1.8
1.5
zOthers
Abbott India
Neutral
4,388
-
9,323
3,153
3,583
14.1
14.4
152.2
182.7
28.8
24.0
141.5
120.9
25.6
26.1
2.7
2.3
Asian Granito
Buy
401
480
1,205
1,066
1,169
11.6
12.5
13.0
16.0
30.8
25.1
3.0
2.7
9.5
10.7
1.4
1.3
Bajaj Electricals
Buy
303
395
3,077
4,801
5,351
5.7
6.2
10.4
13.7
29.1
22.2
3.6
3.2
12.4
14.5
0.6
0.6
Banco Products (India)
Neutral
211
-
1,507
1,353
1,471
12.3
12.4
14.5
16.3
14.5
12.9
20.1
18.1
14.5
14.6
1.1
113.1
Coffee Day Enterprises
Neutral
238
-
4,894
2,964
3,260
20.5
21.2
4.7
8.0
-
29.7
2.8
2.5
5.5
8.5
2.1
1.8
Ltd
Competent Automobiles Neutral
202
-
129
1,137
1,256
3.1
2.7
28.0
23.6
7.2
8.5
38.8
35.0
14.3
11.5
0.1
0.1
Stock Watch
August 11, 2017
Company Name
Reco
CMP
Target
Mkt Cap
Sales ( Čcr )
OPM(%)
EPS (Č)
PER(x)
P/BV(x)
RoE(%)
EV/Sales(x)
(Č)
Price ( Č)
( Č cr )
FY17E
FY18E
FY17E
FY18E
FY17E
FY18E
FY17E
FY18E
FY17E
FY18E
FY17E
FY18E
FY17E
FY18E
zOthers
Elecon Engineering
Neutral
46
-
517
1,482
1,660
13.7
14.5
3.9
5.8
11.8
8.0
2.8
2.6
7.8
10.9
0.7
0.6
Finolex Cables
Neutral
489
-
7,476
2,883
3,115
12.0
12.1
14.2
18.6
34.4
26.3
18.3
16.0
15.8
14.6
2.3
2.1
Garware Wall Ropes
Neutral
870
-
1,903
863
928
15.1
15.2
36.4
39.4
23.9
22.1
4.3
3.7
17.5
15.9
2.1
2.0
Goodyear India*
Neutral
824
-
1,900
1,598
1,704
10.4
10.2
49.4
52.6
16.7
15.7
77.0
67.5
18.2
17.0
0.9
123.7
Hitachi
Neutral
1,928
-
5,243
2,081
2,433
8.8
8.9
33.4
39.9
57.7
48.3
46.6
38.8
22.1
21.4
2.5
2.1
HSIL
Neutral
357
-
2,584
2,384
2,515
15.8
16.3
15.3
19.4
23.4
18.4
23.2
20.0
7.8
9.3
1.3
1.1
Interglobe Aviation
Neutral
1,274
-
46,068
21,122
26,005
14.5
27.6
110.7
132.1
11.5
9.6
68.9
49.2
168.5
201.1
2.2
1.7
Jyothy Laboratories
Neutral
380
-
6,905
1,440
2,052
11.5
13.0
8.5
10.0
44.7
38.0
10.8
10.0
18.6
19.3
5.1
3.5
Kirloskar Engines India
Neutral
390
-
5,641
2,554
2,800
9.9
10.0
10.5
12.1
37.2
32.2
15.5
14.7
10.7
11.7
1.8
1.6
Ltd
Linc Pen & Plastics
Neutral
249
-
369
382
420
9.3
9.5
13.5
15.7
18.5
15.9
3.2
2.7
17.1
17.3
1.0
0.9
M M Forgings
Neutral
582
-
703
546
608
20.4
20.7
41.3
48.7
14.1
12.0
79.8
70.6
16.6
17.0
1.1
1.0
Manpasand Bever.
Neutral
780
-
4,465
836
1,087
19.6
19.4
16.9
23.8
46.2
32.8
5.5
4.8
12.0
14.8
5.1
3.8
Mirza International
Neutral
153
-
1,844
963
1,069
17.2
18.0
6.1
7.5
25.0
20.4
3.8
3.3
15.0
15.7
2.1
1.9
MT Educare
Neutral
60
-
238
366
417
17.7
18.2
9.4
10.8
6.4
5.5
1.4
1.2
22.2
22.3
0.6
0.5
Narayana Hrudaya
Neutral
296
-
6,047
1,873
2,166
11.5
11.7
2.6
4.0
111.9
74.6
6.9
6.2
6.1
8.3
3.3
2.9
Navkar Corporation
Buy
185
265
2,636
347
371
43.2
37.3
6.7
6.0
27.7
30.8
1.9
1.7
6.2
10.6
8.7
8.1
Navneet Education
Neutral
154
-
3,600
1,062
1,147
24.0
24.0
6.1
6.6
25.3
23.3
5.2
4.6
20.6
19.8
3.5
3.2
Nilkamal
Neutral
1,586
-
2,367
1,995
2,165
10.7
10.4
69.8
80.6
22.7
19.7
90.6
78.7
16.6
16.5
1.2
1.0
Page Industries
Neutral
16,216
-
18,087
2,450
3,124
20.1
17.6
299.0
310.0
54.2
52.3
361.2
275.7
47.1
87.5
7.4
5.9
Parag Milk Foods
Neutral
224
-
1,887
1,919
2,231
9.3
9.6
9.5
12.9
23.8
17.3
3.7
3.0
15.5
17.5
1.1
1.0
Quick Heal
Neutral
191
-
1,343
408
495
27.3
27.0
7.7
8.8
24.7
21.8
2.3
2.3
9.3
10.6
2.4
2.0
Radico Khaitan
Accumulate
139
147
1,853
1,667
1,824
13.0
13.2
6.7
8.2
21.0
17.0
1.9
1.7
9.0
10.2
1.5
1.3
Relaxo Footwears
Neutral
486
-
5,834
2,085
2,469
9.2
8.2
7.6
8.0
64.2
61.1
24.9
21.3
17.9
18.8
2.9
2.5
S H Kelkar & Co.
Neutral
252
-
3,650
1,036
1,160
15.1
15.0
6.1
7.2
41.3
35.2
4.4
4.1
10.7
11.5
3.4
3.0
Siyaram Silk Mills
Buy
1,991
2,500
1,866
1,574
1,769
12.5
12.7
97.1
113.1
20.5
17.6
3.2
2.7
15.4
15.5
1.4
1.2
Styrolution ABS India*
Neutral
844
-
1,483
1,440
1,537
9.2
9.0
40.6
42.6
20.8
19.8
53.1
48.2
12.3
11.6
1.0
0.9
Surya Roshni
Neutral
253
-
1,110
3,342
3,625
7.8
7.5
17.3
19.8
14.7
12.8
27.8
22.3
10.5
10.8
0.6
0.5
Team Lease Serv.
Neutral
1,414
-
2,418
3,229
4,001
1.5
1.8
22.8
32.8
62.1
43.1
6.7
5.8
10.7
13.4
0.7
0.5
The Byke Hospitality
Neutral
190
-
763
287
384
20.5
20.5
7.6
10.7
25.0
17.8
5.2
4.2
20.7
23.5
2.7
2.0
Stock Watch
August 11, 2017
Company Name
Reco
CMP
Target Mkt Cap
Sales ( Čcr )
OPM(%)
EPS (Č)
PER(x)
P/BV(x)
RoE(%)
EV/Sales(x)
(Č)
Price ( Č)
( Č cr )
FY17E FY18E FY17E FY18E FY17E FY18E FY17E FY18E FY17E FY18E FY17E FY18E FY17E FY18E
zOthers
Transport Corporation of
Neutral
274
-
2,102
2,671
2,911
8.5
8.8
13.9
15.7
19.8
17.5
2.7
2.4
13.7
13.8
0.9
0.8
India
TVS Srichakra
Neutral
3,407
-
2,609
2,304
2,614
13.7
13.8
231.1
266.6
14.7
12.8
382.8
301.4
33.9
29.3
1.1
1.0
UFO Moviez
Neutral
329
-
909
619
685
33.2
33.4
30.0
34.9
11.0
9.4
1.5
1.3
13.8
13.9
1.2
0.9
Visaka Industries
Neutral
431
-
685
1,051
1,138
10.3
10.4
21.0
23.1
20.5
18.6
55.3
51.8
9.0
9.2
0.9
0.9
VRL Logistics
Neutral
322
-
2,937
1,902
2,119
16.7
16.6
14.6
16.8
22.1
19.1
4.8
4.3
21.9
22.2
1.7
1.5
VIP Industries
Buy
184
218
2,597
1,270
1,450
10.4
10.4
5.6
6.5
32.8
28.3
6.8
5.9
20.7
21.1
2.0
1.8
Navin Fluorine
Accumulate
654
730
3,222
789
945
21.1
22.4
24.0
28.7
27.2
22.8
4.4
3.8
17.8
18.5
4.0
3.3
Source: Company, Angel Research; Note: *December year end; #September year end; &October year end; Price as on August 10, 2017
Market Outlook
August 11, 2017
Research Team Tel: 022 - 39357800
DISCLAIMER
Angel Broking Private Limited (hereinafter referred to as “Angel”) is a registered Member of National Stock Exchange of India
Limited,Bombay Stock Exchange Limited and Metropolitan Stock Exchange Limited. It is also registered as a Depository Participant with
CDSL and Portfolio Manager with SEBI. It also has registration with AMFI as a Mutual Fund Distributor. Angel Broking Private Limited is a
registered entity with SEBI for Research Analyst in terms of SEBI (Research Analyst) Regulations, 2014 vide registration number
INH000000164. Angel or its associates has not been debarred/ suspended by SEBI or any other regulatory authority for accessing
/dealing in securities Market. Angel or its associates/analyst has not received any compensation / managed or
co-managed public offering of securities of the company covered by Analyst during the past twelve months.
This document is solely for the personal information of the recipient, and must not be singularly used as the basis of any investment
decision. Nothing in this document should be construed as investment or financial advice. Each recipient of this document should make
such investigations as they deem necessary to arrive at an independent evaluation of an investment in the securities of the companies
referred to in this document (including the merits and risks involved), and should consult their own advisors to determine the merits and
risks of such an investment.
Reports based on technical and derivative analysis center on studying charts of a stock's price movement, outstanding positions and
trading volume, as opposed to focusing on a company's fundamentals and, as such, may not match with a report on a company's
fundamentals. Investors are advised to refer the Fundamental and Technical Research Reports available on our website to evaluate the
contrary view, if any.
The information in this document has been printed on the basis of publicly available information, internal data and other reliable
sources believed to be true, but we do not represent that it is accurate or complete and it should not be relied on as such, as this
document is for general guidance only. Angel Broking Pvt. Limited or any of its affiliates/ group companies shall not be in any way
responsible for any loss or damage that may arise to any person from any inadvertent error in the information contained in this report.
Angel Broking Pvt. Limited has not independently verified all the information contained within this document. Accordingly, we cannot
testify, nor make any representation or warranty, express or implied, to the accuracy, contents or data contained within this document.
While Angel Broking Pvt. Limited endeavors to update on a reasonable basis the information discussed in this material, there may be
regulatory, compliance, or other reasons that prevent us from doing so.
This document is being supplied to you solely for your information, and its contents, information or data may not be reproduced,
redistributed or passed on, directly or indirectly.
Neither Angel Broking Pvt. Limited, nor its directors, employees or affiliates shall be liable for any loss or damage that may arise from
or in connection with the use of this information.